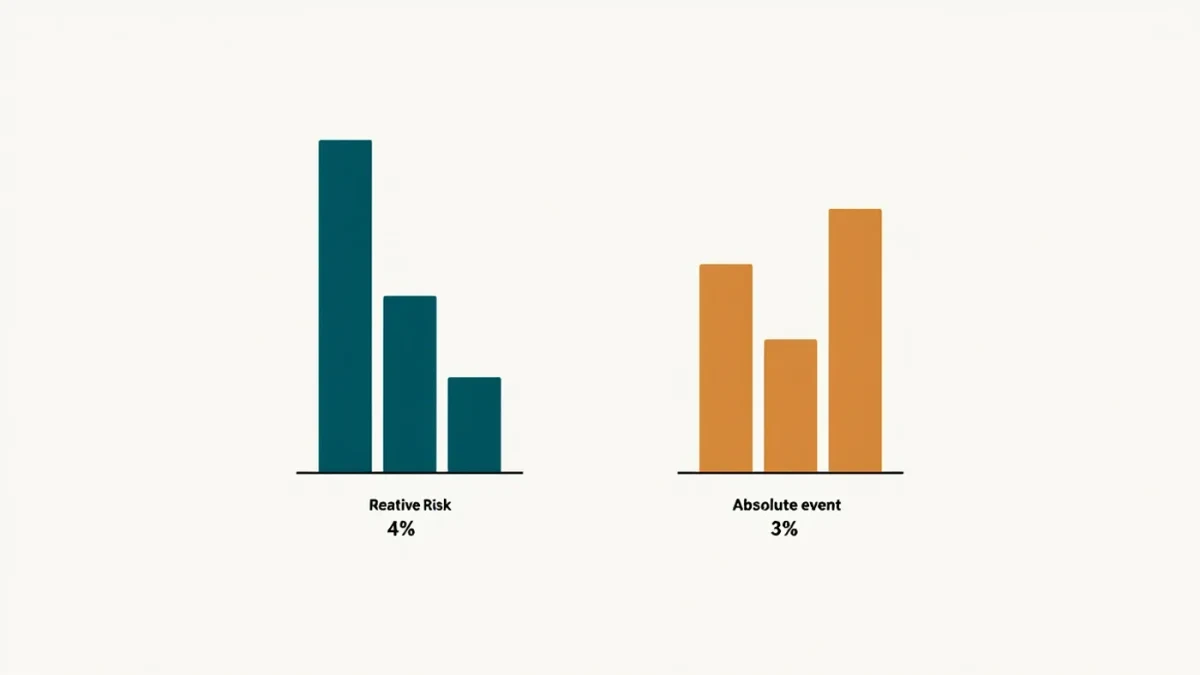

Relative risk compares rates between groups as a ratio; absolute risk states the actual probability that something happens. If a disease affects 2 in 100 people who avoid an exposure and 3 in 100 who have it, the relative risk is 1.5 — a 50 percent increase — while the absolute difference is one percentage point. Both statements are true. Only one tells you what to expect. Health coverage overwhelmingly prefers the relative form, because a ratio of small numbers scales drama in both directions: “meat raises colon cancer risk 20 percent” and “this drug cuts deaths in half” are the same genre of sentence, and both understate what the reader most needs to know — how many people, out of 100, are actually affected.
Risk interpretation interacts with your personal history and baseline probabilities; use the tools here to understand coverage, and bring personal risk questions to a clinician.
The four numbers in every risk story
Every comparative claim contains four quantities, and coverage usually prints one. Relative risk (RR) or hazard ratio: the ratio of event rates. Absolute risk increase or reduction: the difference in rates. Number needed to treat (NNT) or number needed to harm (NNH): the reciprocal of that difference — how many people must be exposed or treated for one additional person to benefit or be harmed. And the baseline rate itself: the probability in the comparison group, which everything else scales from. Consider a hypothetical headline drug “cuts heart attack risk by 40 percent.” If baseline five-year risk is 10 percent, the drug drops it to 6 — an absolute reduction of 4 points, an NNT of 25: twenty-five people take it for five years for one heart attack prevented. If baseline risk is 1 percent, the same relative claim means a drop to 0.6 percent and an NNT of 250. The relative number was identical; the decision is not.
Why relative framing dominates — and when it is honest
The preference is partly psychology and partly practice. Relative risks are transferable across populations with different baselines, which makes them the natural language of epidemiology; an RR measured in one country approximates the RR elsewhere better than an absolute difference does. But the same property is what lets a modest study become an alarming headline. Research on medical journalism, including systematic reviews of how studies are reported in newspapers, has found that relative effects are reported far more often than absolute ones, and that the absolute version, when present, shrinks the perceived importance of most findings. There are cases where relative framing is genuinely informative: large relative effects on common outcomes, replicated across populations — the smoking-lung-cancer association involves roughly tenfold-to-thirtyfold relative risks, where no framing trick is needed to convey the danger.
- Large relative + common outcome: the claim survives any framing; act on it with confidence proportionate to replication.
- Small relative + rare outcome: prime territory for alarm headlines; demand the absolute numbers before caring.
- Large relative + rare outcome: the classic supplement-panic format — a doubling of a 1-in-a-million risk remains 2 in a million.
A field guide to numbers you will actually meet
Hazard ratios from big cohort studies behave like relative risks over a follow-up period and carry the same translation burden. Odds ratios, common in case-control studies, approximate relative risks when the outcome is rare but inflate it when the outcome is common. Percent improvements in survival can mean two opposite things: an absolute survival change (30 to 40 percent) or a relative change in mortality (deaths down from 70 to 60, reported as “14 percent better”), a trick of framing that has been documented in coverage of screening trials for decades. And composite outcomes — “death, heart attack or hospitalization” — let a frequent minor component drive a relative reduction that the serious components barely move.
The one-minute conversion
When you meet any risk claim, reconstruct the absolute arithmetic in three steps. Find the baseline rate — how common is the outcome without the exposure or treatment. Apply the ratio — a 25 percent increase on a baseline of 8 per 1,000 gives 10 per 1,000. Express the difference in natural frequencies — 2 extra cases per 1,000 people, or 1 per 500. That last format is the one humans reason with correctly: researchers who study risk communication, including the influential work of Gigerenzer and colleagues on natural frequencies, have shown that doctors and patients alike make markedly better judgments when risks are stated as frequencies rather than percentages of percentages. If a story never supplies the baseline, you cannot do the conversion — which is itself the tell that the claim is not yet a basis for action.
Baseline confusion cuts the other way too, in the opposite direction. For screening decisions, people routinely overestimate disease prevalence because coverage makes rare conditions feel common — a distortion documented in studies of risk perception, where respondents estimate several cancers as affecting one in five people when the true lifetime figures are a fraction of that. Anchoring on a truthful baseline first, and only then applying any relative change, protects against both inflation and dismissal. It is the same one-minute discipline in reverse: before asking how much a risk changed, establish what it actually was.
What to do differently
Before changing anything over a risk headline, do the conversion, then ask two questions: where did the baseline come from, and does the studied population resemble you. A relative risk in 70-year-old men with prior heart disease may be nearly irrelevant to a healthy 35-year-old and vice versa. Numbers are not the enemy — unconverted numbers are. One minute with the baseline turns nearly any risk story into a decision you can actually weigh.