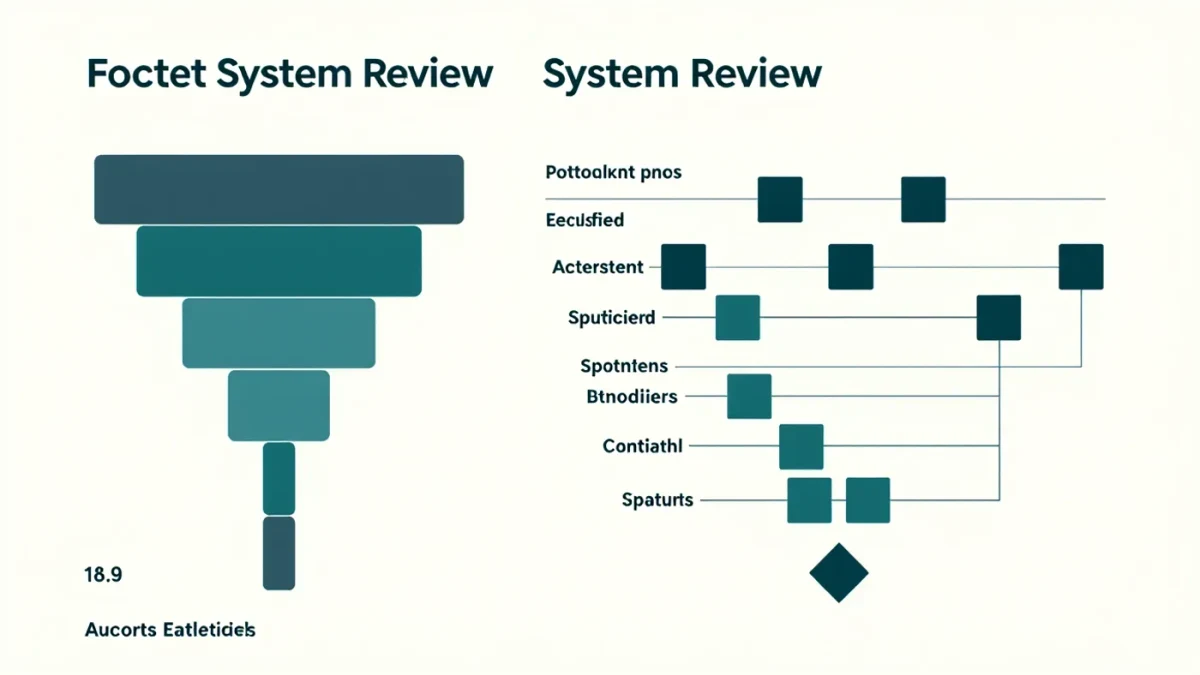

A meta-analysis is a statistical synthesis of results from multiple studies addressing the same question: instead of one trial's estimate, you get a weighted average in which bigger, more precise studies count more. Done well, it is the closest thing medicine has to a final answer on a question — which is why systematic reviews top the evidence hierarchies used by guideline committees, and why the Cochrane Collaboration, the network best known for rigorous versions of them, became a byword for careful synthesis. Done carelessly, a meta-analysis is an arithmetic machine for laundering weak studies into a single confident-sounding number. .
Even a good meta-analysis is one input into a clinical decision that belongs to you and your clinician, alongside your history, preferences and everything else in the record.
What pooling genuinely adds
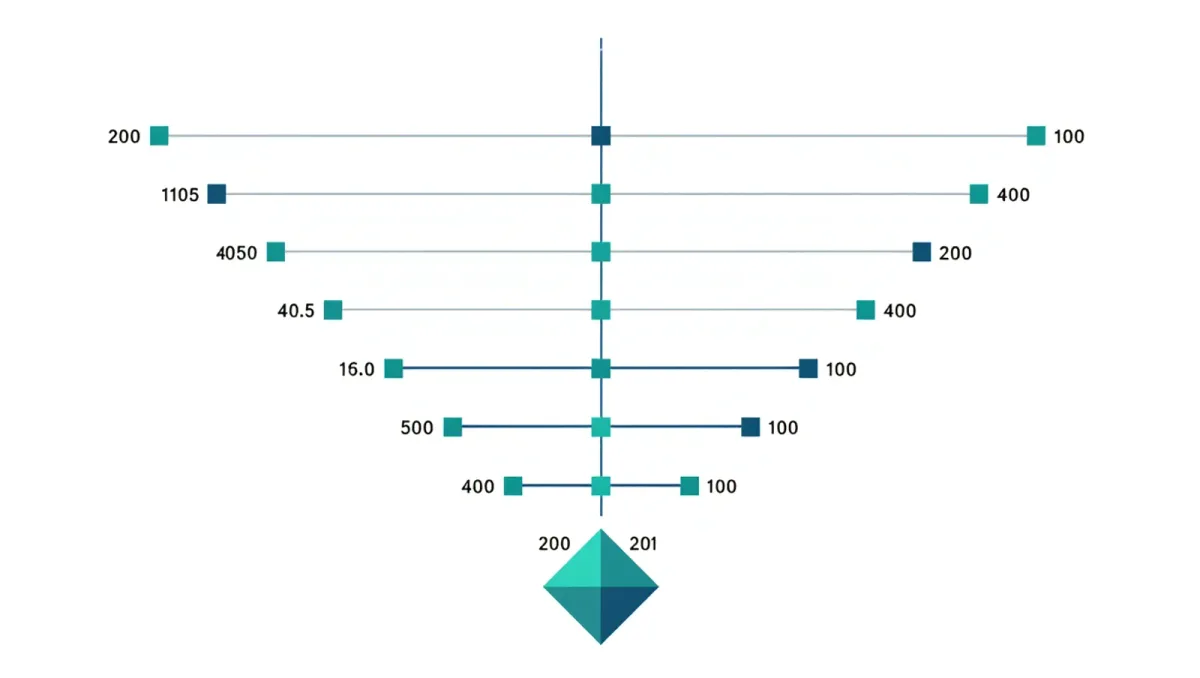
Individual studies are underpowered by design; small trials wobble around the truth in both directions. Pooling averages that noise away and tightens the confidence interval, sometimes answering definitively a question no single trial could settle. It also exposes disagreement: laying study estimates side by side reveals whether the literature tells one story or several — information no single paper contains. The forest plot, the standard graphic, shows each study's result as a square with confidence-interval whiskers and the pooled result as a diamond at the bottom; reading a meta-analysis mostly means reading that plot.
Heterogeneity: the first thing to check
If the studies disagree wildly, the average may describe nothing that exists. Heterogeneity is quantified by the I² statistic — roughly, the percentage of variation across studies that exceeds chance. Convention treats values above about 50 percent as substantial and above 75 percent as severe, though thresholds are guides, not rules. High I² is not automatically fatal: it may reflect genuinely different populations, doses or durations, and a well-built meta-analysis will explore that with subgroup or meta-regression analysis — for instance, separating studies by follow-up length. What it forbids is a single headline number presented as the answer. When you see high heterogeneity and a confident pooled estimate with no exploration, the number is decoration.
- Check inclusion criteria: which studies qualified, and were randomized trials pooled together with observational ones? Mixing designs imports all their weaknesses into one average.
- Check the search: a systematic review searches multiple databases with published criteria; a cherry-picked pool of four studies is not a systematic synthesis, whatever it calls itself.
- Check appraisal: rigorous reviews grade study quality (Cochrane's risk-of-bias tool is standard) and test whether restricting to high-quality studies changes the answer.
Publication bias: the swamp under the pool
Pooling only published studies pools a filtered sample. Small trials with striking results publish; small trials with null results vanish — so the small studies in any pooled estimate are systematically flattering. The funnel plot is the diagnostic: study estimates plotted against precision should scatter symmetrically around the pooled value, and asymmetry — the small studies fanning out on the favorable side — suggests missing negative results. Formal tests such as Egger's regression probe the asymmetry statistically, and trim-and-fill methods estimate how the pooled result would shift if the missing studies existed. The most famous casualty of this logic is the antidepressant-efficacy literature: when the full registry record including unpublished trials was analyzed, the apparent benefit shrank substantially, exactly as publication-bias models predicted.
Meta-analysis is not immune to garbage
The computational label for the failure mode — garbage in, garbage out — earned its fame in this field. Pooling cannot repair biased designs; it reproduces their bias with tighter confidence intervals. A meta-analysis of poorly blinded trials, of industry-funded comparisons against the wrong dose, or of observational diet records inherits each flaw and adds a veneer of precision. The evidence-based-medicine community's response has been to grade not just study quality but certainty across the whole body of evidence — the GRADE framework used by major guideline bodies downgrades pooled findings for risk of bias, inconsistency, imprecision and indirectness, which is why a guideline sometimes recommends weakly despite a large pooled estimate existing.
Network meta-analyses add one more layer worth flagging. These compare multiple treatments simultaneously by combining direct head-to-head trials with indirect comparisons across shared comparators, and they power much of today's drug-ranking coverage. The added power comes with added assumptions: that the indirect links are as trustworthy as direct ones, an assumption called transitivity that can quietly fail when trial populations differ across the network. Serious network meta-analyses test this with inconsistency analyses and rate the certainty of each comparison separately. When a headline declares treatment X best in class on the strength of one, the concrete question to ask is whether direct head-to-head evidence exists for the top pair, or whether the ranking is mostly indirect arithmetic.
Reading one in ten minutes
- Read the question and inclusion criteria — PICO format (population, intervention, comparator, outcome) at the top of most reviews tells you whether this synthesis addresses your actual question.
- Look at the forest plot — how consistent are the studies, and does the exclusion of any single large study collapse the diamond? (Check for a leave-one-out sensitivity analysis.)
- Find I², the funnel plot and risk-of-bias assessments — their presence signals competence; their absence signals decoration.
- Compare the pooled absolute effect with the abstract's language — a statistically significant but clinically trivial result still reads confidently in press releases.
The summary judgment: a meta-analysis is the best evidence available when the underlying trials were good, the pool was honest and the heterogeneity was explored — and merely the most citable form of noise when any of those three fails. The pyramid is right about where this design sits, but the design does not sanitize what sits beneath it.