A p-value answers one narrow question: if there were truly no effect, how likely is data at least this extreme? A result reported as p = 0.03 means that under the assumption of no effect, data this extreme would appear about three percent of the time. It does not mean the result has a 97 percent chance of being true, does not measure how big the effect is, and does not establish that the finding matters for your health. The American Statistical Association said this explicitly in its 2016 statement on p-values — a rare formal warning from the profession that its own signature statistic is routinely misread, including the misuse of the 0.05 threshold as a magic line separating real effects from noise.
This article is information, not medical or statistical advice. Interpreting research involves judgment about design, size and context; for decisions about your health, the numbers here are background, and your clinician weighs them alongside everything else.
Where the 0.05 line came from — and what it became
The threshold descends from early twentieth-century statistics, where the statistician Ronald Fisher suggested p below about 1 in 20 was worth a second look — a convention for skepticism, not a certification. Over decades it calcified into publication logic: results below 0.05 get published and become headlines; results at 0.06 go into the file drawer. That asymmetry creates the file-drawer problem — the published literature overrepresents striking results, so the baseline of what you see in coverage is already tilted toward the dramatic. Meta-researchers, including the team behind the Open Science Collaboration's 2015 reproduction project in psychology, documented how fragile that literature can be: large fractions of celebrated findings failed to reproduce at similar effect sizes.
Statistically significant is not clinically significant
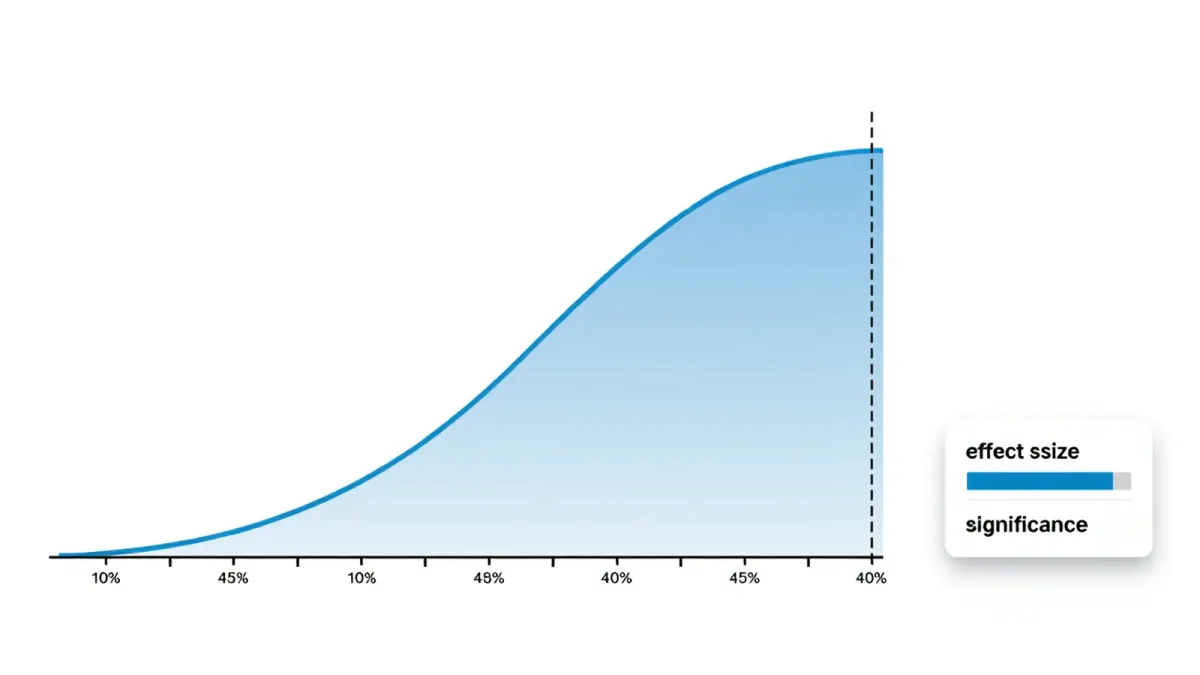
With a large enough sample, trivially small differences become statistically significant. A trial of 80,000 people can show a 0.2 percent difference in some outcome with p < 0.001 — a real association, and a difference you will never notice in a life. The headline, however, prints the p-value and skips the size. When you read coverage of any study, the two numbers to hunt for are the effect size (how much difference, in meaningful units) and the confidence interval (the range of plausible effect sizes the data support). A wide interval around a small effect means the honest summary is “we barely know anything yet.”
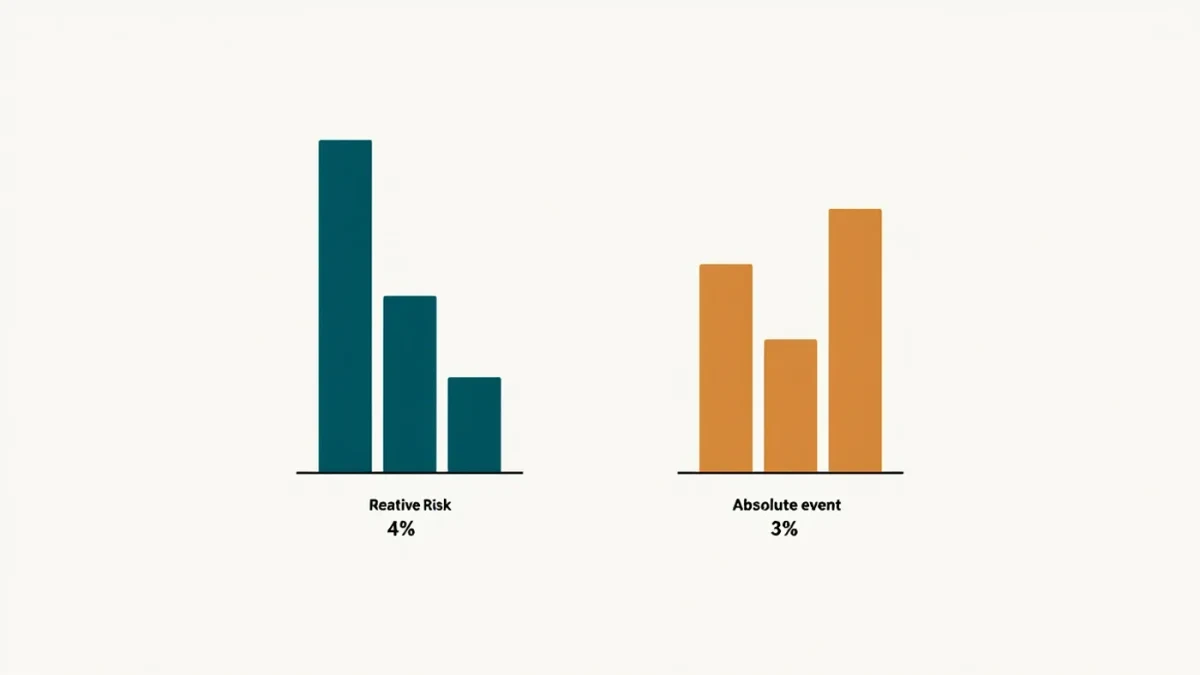
- p = 0.03 with a 40 percent risk reduction is a different universe from p = 0.03 with a 2 percent reduction — same statistical stamp, opposite practical weight.
- A p-value never travels alone: sample size, endpoints, dropout rates and whether the analysis was pre-specified all change what the same p-value means.
- Multiple testing inflates false positives: if researchers test 20 correlations, one will typically clear 0.05 by chance alone; large datasets mined for associations run this trap constantly.
How p-hacking manufactures headlines
The threshold's abuse has a name. P-hacking is the practice of trying analyses until something crosses 0.05: slicing the data by subgroups, swapping endpoints mid-study, adding or removing covariates, or stopping data collection at the lucky moment. None of this requires dishonesty — the researcher can sincerely believe the significant subgroup is a discovery. The defense is procedural: pre-registration, where the primary outcome and analysis are declared before data collection, is now required or encouraged by major journals and registries such as ClinicalTrials.gov. When you read a headline resting on a subgroup finding — “works in women over 50” — that is exactly the pattern worth discounting, because planned and unplanned analyses look identical in a press release.
A note on the vocabulary you will meet. “Significant” in a paper means only that the p-value cleared a threshold; “trend toward significance” for a p of 0.08 is not a weak discovery but a non-result with better manners. And “nonsignificant” never means “no effect was proven absent” — absence of evidence is a sample-size statement as often as a nature-of-the-world statement. Translating these habits into plain reading takes a week of attention, after which most health coverage resolves quickly into one of three bins: genuinely informative, preliminary-but-honest, and noise wearing a lab coat.
Reading the numbers in practice
Take a plausible claim: a study reports that people who drink coffee have p = 0.04 lower rates of some disease. Before the finding means anything you need: the size of the reduction (two percent or forty percent?), whether the analysis was pre-registered, how many outcomes were tested, whether confounders like income and smoking were handled, and whether other studies found anything similar. The p-value will be the same in every version of that story — which is precisely why it cannot be the number that carries your conclusion.
History offers a caution on thresholds themselves. In 2016, following the ASA statement, a debate broke out in the statistical community about whether the 0.05 convention should be abandoned altogether, with prominent researchers proposing that journals reject the phrase “statistically significant” and report uncertainty directly instead. Some major journals have since adopted guidance along those lines, and leading methods papers have argued the case at length. The practical consequence for readers: increasingly, better papers lead with effect sizes and intervals, and a headline resting entirely on a p-value is itself a hint the finding is thin.
Sample size deserves one final sentence of respect: small trials with dramatic p-values deserve more suspicion than large trials with modest ones, because tiny samples both exaggerate observed effects when luck strikes and produce unstable estimates that reverse on repetition. When you see a striking claim from a study of 30 people, the correct prior is that the truth, whatever it is, is smaller.
What to do differently with the next study
Skip past the significance claim to three concrete items: effect size with units, confidence interval, and study design. If coverage offers none of these, the coverage is not yet evidence of anything. And when a claim matters to you personally, bring the paper — not the headline — to your clinician: a five-minute look at the actual effect size usually settles whether the finding is a practice-changer or a press release.